
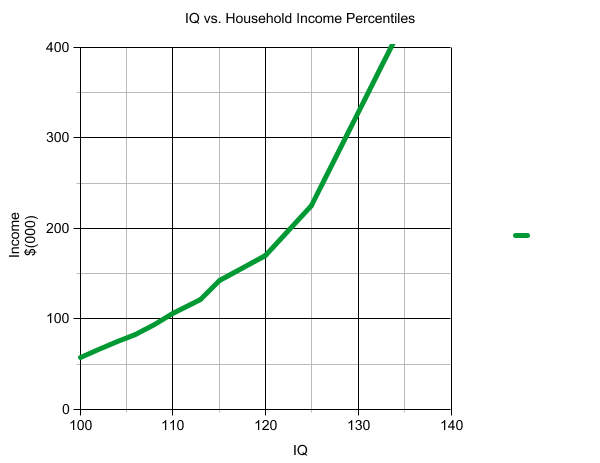
Here’s a graph that I made of IQ vs. US Household Income percentiles. In other words, I looked up the percentiles for IQ and cross-referenced them with the percentiles for US Household Income.
Of course, financial status is a function of many factors such as intelligence, luck, hard work, and life choices. Perhaps the value of this graph is in indicating how much financial status is affected by those other factors.
References are IQ Comparison Chart and United States Household Income Brackets and Percentiles in 2017. I made this graph by using Create a Graph.
(And to promote my science fiction novel: The Wizard from Earth.)
